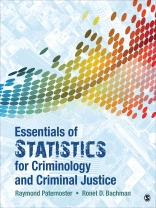
Essentials of Statistics for Criminology and Criminal Justice helps students understand the vital role that research and statistics play in the study of criminology and criminal justice by showing them how to conduct and interpret statistics in real-world settings with a step-by-step approach to solving problems. This practical, applied approach offers students the fundamentals of descriptive and inferential statistics in a concise and easy-to-understand format—avoiding complicated proofs and discussions of statistical theory. The examples and case studies provide relevant examples for criminology and criminal justice students, and deal with contemporary issues related to crime, corrections, police, and the judicial system. Students will not only learn about the ‘how to’ in statistics, but they will also recognize its importance in today’s criminal justice system.
विषयसूची
Chapter 1. Setting the Stage: Why Learning This Stuff is Important!
Setting the Stage for Statistical Inquiry
The Role of Statistical Methods in Criminology and Criminal Justice
Populations and Samples
Descriptive and Inferential Statistics
Levels of Measurement
Ways of Presenting Variable
Units of Analysis
Chapter 2. Understanding Data Distributions With Tables and Graphs
The Tabular and Graphical Display of Qualitative Data
The Tabular and Graphical Display of Quantitative Data
The Shape of a Distribution
Time Plots
Chapter 3. Measures of Central Tendency
The Mode
The Median
The Mean
Chapter 4. Measures of Dispersion
Measuring Dispersion for Nominal- and Ordinal-Level Variables
Measuring Dispersion for Internal- and Ratio-Level Variables
The Standard Deviation and Variance
Computational Formulas for Variance and Standard Deviation
Chapter 5. Moving Beyond Description: Introducing Inferential Statistics: Probability Distributions and an Introduction to Hypothesis Testing
Probability. What Is It Good for? Absolutely Everything!
The Rules of Probability
Probability Distributions
Samples, Populations, Sampling Distributions, and the Central Limit Theorem
Chapter 6. Point Estimation and Confidence Intervals
Making Inferences from Point Estimates: Confidence Intervals
Estimating a Population Mean From Large Samples
Estimating Confidence Intervals for a Mean From Small Samples
Estimating Confidence Intervals for Proportions and Percents With a Large Sample
Chapter 7. Hypothesis Testing for One Population Mean and Proportion
Hypothesis Testing for Population Means Using A Large Sample: The Z Test
Directional and Non-directional Hypothesis Tests
Hypothesis Testing for Population Means Using Small Samples: The t Test
Hypothesis Testing for Population Proportions and Percents Using Large Samples
Chapter 8.Testing Hypotheses With Two Categorical Variables
Contingency Tables and the Two Variable Chi-Square Test of Independence
The Chi-Square Test of Independence
A Simple-to-Use Computational Formula for the Chi-Square Test of Independence
Measures of Association: Determining the Strength of the Relationship Between Two Categorical Variables
Chapter 9. Hypothesis Tests Involving Two Population Means or Proportions
Explaining the Difference Between Two Sample Means
Sampling Distribution of Mean Differences
Testing a Hypothesis About the Difference Between Two Means: Independent Samples
Matched-Groups or Dependent-Samples t Test
Hypothesis Tests for the Difference Between Two Proportions: Large Samples
Chapter 10. Hypothesis Testing Involving Three or More Population Means: Analysis of Variance
The Logic of Analysis of Variance
Types of Variance: Total, Between-Groups, and Within-Group
Conducting a Hypothesis Test With ANOVA
After the F Test: Testing the Difference Between Pairs of Means
A Measure of Association Test With ANOVA
A Second ANOVA Example: Caseload Size and Success on Probation
Chapter 11. Bivariate Correlation and Ordinary Least Squares (OLS) Regression
Graphing the Bivariate Distribution Between Two Quantitative Variables: Scatterplots
The Pearson Correlation Coefficient
A More Precise Way to Interpret a Correlation: The Coefficient of Determination
The Least-Squares Regression Line and the Slope Coefficient
Comparison of b and r
Testing for the Significance of b and r
Chapter 12. Controlling for a Third Variable: Multiple OLS Regression
What Do We Mean by Controlling for Other Important Variables?
The Multiple Regression Equation
Comparing the Strength of a Relationship Using Beta Weights
Partial Correlation Coefficients
Hypothesis Testing in Multiple Regression
Another Example: Prison Density, Mean Age, and Rate of Inmate Violence
Appendix A. Review of Basic Mathematical Operations
Appendix B. Statistical Tables
Appendix C. Solutions for Odd-Numbered Practice Problems
Appendix D. SPSS Exercises
लेखक के बारे में
Ronet D. Bachman, Ph D, worked as a statistician at the Bureau of Justice Statistics, U.S.Department of Justice, before going back to an academic career; she is now a professor in the Department of Sociology and Criminal Justice at the University of Delaware. She is coauthorof Statistical Methods for Criminology and Criminal Justice and coeditor of Explaining Criminalsand Crime: Essays in Contemporary Criminal Theory. In addition, she is the author of Death and Violence on the Reservation and coauthor of Stress, Culture, and Aggression; Murder American Style; and Violence: The Enduring Problem, along with numerous articles and papers that examinethe epidemiology and etiology of violence, with particular emphasis on women, the elderly, and minority populations as well as research examining desistance from crime. Her most recentfederally funded research was a mixed-methods study that examined the long-term desistancetrajectories of criminal justice involved drug-involved individuals who have been followed withboth quantitative and interview data for nearly thirty years. Her current state-funded research isassessing the needs of violent crime victims, especially those whose voices are rarely heard suchas loved ones of homicide victims.


