Designed to introduce students to quantitative methods in a way that can be applied to all kinds of data in all kinds of situations,
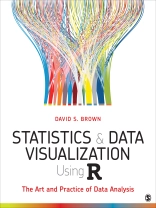
Statistics and Data Visualization Using R: The Art and Practice of Data Analysis by David S. Brown teaches students statistics through charts, graphs, and displays of data that help students develop intuition around statistics as well as data visualization skills. By focusing on the visual nature of statistics instead of mathematical proofs and derivations, students can see the relationships between variables that are the foundation of quantitative analysis. Using the latest tools in R and R RStudio® for calculations and data visualization, students learn valuable skills they can take with them into a variety of future careers in the public sector, the private sector, or academia. Starting at the most basic introduction to data and going through most crucial statistical methods, this introductory textbook quickly gets students new to statistics up to speed running analyses and interpreting data from social science research.
Tabella dei contenuti
Preface
Acknowledgments
About the Author
Chapter 1: Getting Started
Learning Objectives
Overview
R, RStudio, and R Markdown
Objects and Functions
Getting Started in RStudio
Navigating RStudio With R Markdown
Using R Markdown Files Versus R-Scripts
A Little Practice
Summary
Common Problems
Review Questions
Practice on Analysis and Visualization
Annotated R Functions
Answers
Chapter 2: An Introduction to Data Analysis
Learning Objectives
Overview
Motivating Data Analysis
The Main Components of Data Analysis
Developing Hypotheses by Describing Data
Model Building and Estimation
Diagnostics
Next Questions
Summary
Common Problems
Review Questions
Practice on Analysis and Visualization
Annotated R Functions
Answers
Chapter 3: Describing Data
Learning Objectives
Overview
Data Sets and Variables
Different Kinds of Variables
Describing Data Saves Time and Effort
Measurement
Summary
Common Problems
Review Questions
Practice on Analysis and Visualization
Annotated R Functions
Answers
Chapter 4: Central Tendency and Dispersion
Learning Objectives
Overview
Measures of Central Tendency: The Mode, Mean, and Median
Mean Versus Median
Measures of Dispersion: The Range, Interquartile Range, and Standard Deviation
Interquartile Range Versus Standard Deviation
Summary
Common Problems
Review Questions
Practice on Analysis and Visualization
Annotated R Functions
Answers
Chapter 5: Univariate and Bivariate Descriptions of Data
Learning Objectives
Overview
The Good, the Bad, and the Outlier
Five Views of Univariate Data
Are They in a Relationship?
Summary
Common Problems
Review Questions
Practice on Analysis and Visualization
Annotated R Functions
Answers
Chapter 6: Transforming Data
Learning Objectives
Overview
Theoretical Reasons for Transforming Data
Transforming Data for Practical Reasons
Transforming Data—Continuous to Categorical Variables
Transforming Data—Changing Categories
Box-Cox Transformations
Summary
Common Problems
Review Questions
Practice on Analysis and Visualization
Annotated R Functions
Answers
Chapter 7: Some Principles of Displaying Data
Learning Objectives
Overview
Some Elements of Style
The Basic Elements of a Story
Documentation (Establishing Credibility as a Storyteller)
Build an Intuition (Setting the Context)
Show Causation (The Journey)
From Causation to Action (The Resolution)
Summary
Common Problems
Review Questions
Practice on Analysis and Visualization
Annotated R Functions
Answers
Chapter 8: The Essentials of Probability Theory
Overview
Learning Objectives
Populations and Samples
Sample Bias and Random Samples
The Law of Large Numbers
The Central Limit Theorem
The Standard Normal Distribution
Summary
Common Problems
Review Questions
Practice on Analysis and Visualization
Annotated R Functions
Answers
Chapter 9: Confidence Intervals and Testing Hypotheses
Learning Objectives
Overview
Confidence Intervals With Large Samples
Small Samples and the t-Distribution
Comparing Two Sample Means
Confidence Levels
A Brief Note on Statistical Inference and Causation
Summary
Common Problems
Review Questions
Practice on Analysis and Visualization
Annotated R Functions
Answers
Chapter 10: Making Comparisons
Overview
Learning Objectives
Why Do We Make Comparisons?
Questions That Beg Comparisons
Comparing Two Categorical Variables
Comparing Continuous and Categorical Variables
Comparing Two Continuous Variables
Exploratory Data Analysis: Investigating Abortion Rates in the United States
Good Analysis Generates Additional Questions
Summary
Common Problems
Review Questions
Practice on Analysis and Visualization
Annotated R Functions
Answers
Chapter 11: Controlled Comparisons
Learning Objectives
Overview
What Is a Controlled Comparison?
Comparing Two Categorical Variables, Controlling for a Third
Comparing Two Continuous Variables, Controlling for a Third
Arguments and Controlled Comparisons
Summary
Common Problems
Review Questions
Practice on Analysis and Visualization
Annotated R Functions
Answers
Practice on Analysis and Visualization
Chapter 12: Linear Regression
Learning Objectives
Overview
The Advantages of Linear Regression
The Slope and Intercept in Linear Regression
Goodness of Fit (R2 Statistic)
Statistical Significance
Examples of Bivariate Regressions
Summary
Common Problems
Review Questions
Practice on Analysis and Visualization
Annotated R Functions
Answers
Chapter 13: Multiple Regression
Learning Objectives
Overview
What Is Multiple Regression?
Regression Models and Arguments
Regression Models, Theory, and Evidence
Interpreting Estimates in Multiple Regression
Example: Homicide Rate and Education
Summary
Common Problems
Review Questions
Practice on Analysis and Visualization
Annotated R Functions
Answers
Practice on Analysis and Visualization
Chapter 14: Dummies and Interactions
Learning Objectives
Overview
What Is a Dummy Variable?
Additive Models and Interactive Models
Bivariate Dummy Variable Regression
Multiple Regression and Dummy Variables
Interactions in Multiple Regression
Summary
Common Problems
Review Questions
Practice on Analysis and Visualization
Annotated R Functions
Answers
Chapter 15: Diagnostics I: Is Ordinary Least Squares Appropriate?
Learning Objectives
Overview
Diagnostics in Regression Analysis
Properties of Statistics and Estimators
The Gauss-Markov Assumptions
The Residual Plot
Summary
Common Problems
Review Questions
Practice on Analysis and Visualization
Annotated R Functions
Answers
Chapter 16: Diagnostics II: Residuals, Leverages, and Measures of Influence
Learning Objectives
Overview
Outliers
Leverages
Measures of Influence
Added Variable Plots
Summary
Common Problems
Review Questions
Practice on Analysis and Visualization
Annotated R Functions
Answers
Chapter 17: Logistic Regression
Learning Objectives
Overview
Questions and Problems That Require Logistic Regression
Logistic Regression Violates Gauss-Markov Assumptions
Working With Logged Odds
Working With Predicted Probabilities
Model Fit With Logistic Regression
Summary
Common Problems
Review Questions
Practice on Analysis and Visualization
Annotated R Functions
Answers
Appendix: Developing Empirical Implications
Overview
Developing Empirical Implications
Testing Additional Dependent Variables
Testing Additional Independent Variables
Using Information on Cases
Causal Mechanisms
The Rabbit Hole
Glossary
References
Index
Circa l’autore
David Brown is a Professor and Divisional Dean of Social Sciences at the University of Colorado Boulder.


