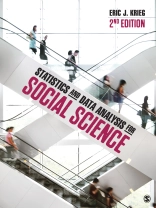
Apply statistics to your everyday life.
Statistics and Data Analysis for Social Science helps students to build a strong foundational understanding of statistics by providing clarity around when and why statistics useful. Rather than focusing on the ‘how to’ of statistics, author Eric J. Krieg simplifies the complexity of statistical calculations by introducing only what is necessary to understanding each concept. Every chapter is written around and applied to a different social problem or issues—enabling students to broaden their imagination about the statistical ‘tools’ that can be used to make sense of our world and, maybe, to make the world a better place.
In addition to updating all the tables and examples with new data, the Second Edition has replaced the section on SPSS with three new sets of exercises at the end of each chapter:
Зміст
Preface
Acknowledgments
About the Author
Chapter 1: Concepts, Variables, and Measurement
Introduction
Concepts
Why Statistics?
Variables
Measurement
Graphical Representation of Data (What Data “Look” Like)
Validity and Reliability
Chapter Summary
Chapter 2: Frequency Tables
Introduction
Toxic Waste and “Superfund”
Frequency Tables
Superfund Sites: Frequency Table for a Nominal Variable
Frequency Table for an Ordinal Variable
Frequency Table for an Interval/Ratio Variable
Chapter Summary
Chapter 3: Measures of Central Tendency
Introduction
Averages and Energy Consumption
Definitions of Mode, Median, and Mean
Calculating Measures of Central Tendency With Raw Data
Calculating Measures of Central Tendency With Grouped Data
Chapter Summary
Chapter 4: Measures of Dispersion
Introduction
The Distribution of Education in the United States
Range
Interquartile Range
Mean Absolute Deviation
Variance (S2)
Standard Deviation (S)
Standard Deviation and the Normal Curve
Chapter Summary
Chapter 5: Probability and the Normal Curve
Introduction
Intelligence, Life Chances, and Inequality
The Fundamentals of Probability
Probability Using Frequency Tables
Probability and the Normal Curve
Using z-Scores to Find Percentiles
Chapter Summary
Chapter 6: Probability—From Samples to Statistics
Introduction
The Politics of Sampling: Global Warming and Political Party Affiliation
Sampling and Statistics
The Standard Error of the Mean
The Standard Error of the Proportion
Other Confidence Intervals
The t Distribution
Hypotheses and Testing Differences Between Means
Potential Errors: Type I and Type II
Chapter Summary
Chapter 7: Cross-tabulation and Chi-Square
Introduction
The “Environmental Decade”
Cross-tabulation Tables
Cross-tabulation and the Chi-Square Test of Statistical Significance
Chapter Summary
Chapter 8: Measures of Association for Categorical Variables
Introduction
Social Institutions and Social Control
Nominal Measures of Association
Ordinal Measures of Association
Chapter Summary
Chapter 9: Analysis of Variance
Introduction
Smoking on Campus
Analysis of Variance
Chapter Summary
Chapter 10: Correlation and Regression
Introduction
Unequal America
Scatterplots: The Underlying Logic Behind Correlation
Correlation
Linear Regression
Chapter Summary
Appendix
Answers to Chapter Exercises
Answers to In-Class Exercises
Glossary
References
Index


