Recipient of a 2021 Most Promising New Textbook Award from the Textbook & Academic Authors Association (TAA)
‘
Statistics with R is easily the most accessible and almost fun introduction to statistics and R that I have read. Even the most hesitant student is likely to embrace the material with this text.’
—David A.M. Peterson,
Department of Political Science, Iowa State University
Drawing on examples from across the social and behavioral sciences,
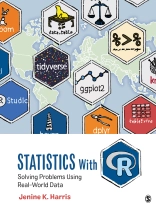
Statistics with R: Solving Problems Using Real-World Data introduces foundational statistics concepts with beginner-friendly R programming in an exploration of the world’s tricky problems faced by the ‘R Team’ characters. Inspired by the programming group ‘R Ladies, ‘ the R Team works together to master the skills of statistical analysis and data visualization to untangle real-world, messy data using R. The storylines draw students into investigating contemporary issues such as marijuana legalization, voter registration, and the opioid epidemic, and lead them step-by-step through full-color illustrations of R statistics and interactive exercises.
Included with this title:
The password-protected Instructor Resource Site (formally known as SAGE Edge) offers access to all text-specific resources, including a test bank and editable, chapter-specific Power Point® slides.
Tabla de materias
PREFACE
ABOUT THE AUTHOR
Chapter 1: Preparing Data for Analysis and Visualization in R: The R-Team and the Pot Policy Problem
1.1 Choosing and learning R
1.2 Learning R with publicly available data
1.3 Achievements to unlock
1.4 The tricky weed problem
1.5 Achievement 1: Observations and variables
1.6 Achievement 2: Using reproducible research practices
1.7 Achievement 3: Understanding and changing data types
1.8 Achievement 4: Entering or loading data into R
1.9 Achievement 5: Identifying and treating missing values
1.10 Achievement 6: Building a basic bar chart
1.11 Chapter summary
Chapter 2: Computing and Reporting Descriptive Statistics: The R-Team and the Troubling Transgender Health Care Problem
2.1 Achievements to unlock
2.2 The transgender health care problem
2.3 Data, codebook, and R packages for learning about descriptive statistics
2.4 Achievement 1: Understanding variable types and data types
2.5 Achievement 2: Choosing and conducting descriptive analyses for categorical (factor) variables
2.6 Achievement 3: Choosing and conducting descriptive analyses for continuous (numeric) variables
2.7 Achievement 4: Developing clear tables for reporting descriptive statistics
2.8 Chapter summary
Chapter 3: Data Visualization: The R-Team and the Tricky Trigger Problem
3.1 Achievements to unlock
3.2 The tricky trigger problem
3.3 Data, codebook, and R packages for graphs
3.4 Achievement 1: Choosing and creating graphs for a single categorical variable
3.5 Achievement 2: Choosing and creating graphs for a single continuous variable
3.6 Achievement 3: Choosing and creating graphs for two variables at once
3.7 Achievement 4: Ensuring graphs are well-formatted with appropriate and clear titles, labels, colors, and other features
3.8 Chapter summary
Chapter 4: Probability Distributions and Inference: The R-Team and the Opioid Overdose Problem
4.1 Achievements to unlock
4.2 The awful opioid overdose problem
4.3 Data, codebook, and R packages for learning about distributions
4.4 Achievement 1: Defining and using the probability distributions to infer from a sample
4.5 Achievement 2: Understanding the characteristics and uses of a binomial distribution of a binary variable
4.6 Achievement 3: Understanding the characteristics and uses of the normal distribution of a continuous variable
4.7 Achievement 4: Computing and interpreting z-scores to compare observations to groups
4.8 Achievement 5: Estimating population means from sample means using the normal distribution
4.9 Achievement 6: Computing and interpreting confidence intervals around means and proportions
4.10 Chapter summary
Chapter 5: Computing and Interpreting Chi-Squared: The R-Team and the Vexing Voter Fraud Problem
5.1 Achievements to unlock
5.2 The voter fraud problem
5.3 Data, documentation, and R packages for learning about chi-squared
5.4 Achievement 1: Understanding the relationship between two categorical variables using bar charts, frequencies, and percentages
5.5 Achievement 2: Computing and comparing observed and expected values for the groups
5.6 Achievement 3: Calculating the chisquared statistic for the test of independence
5.7 Achievement 4: Interpreting the chi-squared statistic and making a conclusion about whether or not there is a relationship
5.8 Achievement 5: Using Null Hypothesis Significance Testing to organize statistical testing
5.9 Achievement 6: Using standardized residuals to understand which groups contributed to significant relationships
5.10 Achievement 7: Computing and interpreting effect sizes to understand the strength of a significant chi-squared relationship
5.11 Achievement 8: Understanding the options for failed chi-squared assumptions
5.12 Chapter summary
Chapter 6: Conducting and Interpreting t-Tests: The R-Team and the Blood Pressure Predicament
6.1 Achievements to unlock
6.2 The blood pressure predicament
6.3 Data, codebook, and R packages for learning about t-tests
6.4 Achievement 1: Understanding the relationship between one categorical variable and one continuous variable using histograms, means, and standard deviations
6.5 Achievement 2: Comparing a sample mean to a population mean with a one-sample t-test
6.6 Achievement 3: Comparing two unrelated sample means with an independent-samples t-test
6.7 Achievement 4: Comparing two related sample means with a dependent-samples t-test
6.8 Achievement 5: Computing and interpreting an effect size for significant t-tests
6.9 Achievement 6: Examining and checking the underlying assumptions for using the t-test
6.10 Achievement 7: Identifying and using alternate tests when t-test assumptions are not met
6.11 Chapter summary
Chapter 7: Analysis of Variance: The R-Team and the Technical Difficulties Problem
7.1 Achievements to unlock
7.2 The technical difficulties problem
7.3 Data, codebook, and R packages for learning about ANOVA
7.4 Achievement 1: Exploring the data using graphics and descriptive statistics
7.5 Achievement 2: Understanding and conducting one-way ANOVA
7.6 Achievement 3: Choosing and using post hoc tests and contrasts
7.7 Achievement 4: Computing and interpreting effect sizes for ANOVA
7.8 Achievement 5: Testing ANOVA assumptions
7.9 Achievement 6: Choosing and using alternative tests when ANOVA assumptions are not met
7.10 Achievement 7: Understanding and conducting two-way ANOVA
7.11 Chapter summary
Chapter 8: Correlation Coefficients: The R-Team and the Clean Water Conundrum
8.1 Achievements to unlock
8.2 The clean water conundrum
8.3 Data and R packages for learning about correlation
8.4 Achievement 1: Exploring the data using graphics and descriptive statistics
8.5 Achievement 2: Computing and interpreting Pearson’s r correlation coefficient
8.6 Achievement 3: Conducting an inferential statistical test for Pearson’s r correlation coefficient
8.7 Achievement 4: Examining effect size for Pearson’s r with the coefficient of determination
8.8 Achievement 5: Checking assumptions for Pearson’s r correlation analyses
8.9 Achievement 6: Transforming the variables as an alternative when Pearson’s r correlation assumptions are not met
8.10 Achievement 7: Using Spearman’s rho as an alternative when Pearson’s r correlation assumptions are not met
8.11 Achievement 8: Introducing partial correlations
8.12 Chapter summary
Chapter 9: Linear Regression: The R-Team and the Needle Exchange Examination
9.1 Achievements to unlock
9.2 The needle exchange examination
9.3 Data, codebook, and R packages for linear regression practice
9.4 Achievement 1: Using exploratory data analysis to learn about the data before developing a linear regression model
9.5 Achievement 2: Exploring the statistical model for a line
9.6 Achievement 3: Computing the slope and intercept in a simple linear regression
9.7 Achievement 4: Slope interpretation and significance (b1, p-value, CI)
9.8 Achievement 5: Model significance and model fit
9.9 Achievement 6: Checking assumptions and conducting diagnostics
9.10 Achievement 7: Adding variables to the model and using transformation
9.11 Chapter summary
Chapter 10: Binary Logistic Regression: The R-Team and the Perplexing Libraries Problem
10.1 Achievements to unlock
10.2 The perplexing libraries problem
10.3 Data, codebook, and R packages for logistic regression practice
10.4 Achievement 1: Using exploratory data analysis before developing a logistic regression model
10.5 Achievement 2: Understanding the binary logistic regression statistical model
10.6 Achievement 3: Estimating a simple logistic regression model and interpreting predictor significance and interpretation
10.7 Achievement 4: Computing and interpreting two measures of model fit
10.8 Achievement 5: Estimating a larger logistic regression model with categorical and continuous predictors
10.9 Achievement 6: Interpreting the results of a larger logistic regression model
10.10 Achievement 7: Checking logistic regression assumptions and using diagnostics to identify outliers and influential values
10.11 Achievement 8: Using the model to predict probabilities for observations that are outside the data set
10.12 Achievement 9: Adding and interpreting interaction terms in logistic regression
10.13 Achievement 10: Using the likelihood ratio test to compare two nested logistic regression models
10.14 Chapter summary
Chapter 11: Multinomial and Ordinal Logistic Regression: The R-Team and the Diversity Dilemma in STEM
11.1 Achievements to unlock
11.2 The diversity dilemma in STEM
11.3 Data, codebook, and R packages for multinomial and ordinal regression practice
11.4 Achievement 1: Using exploratory data analysis for multinomial logistic regression
11.5 Achievement 2: Estimating and interpreting a multinomial logistic regression model
11.6 Achievement 3: Checking assumptions for multinomial logistic regression
11.7 Achievement 4: Using exploratory data analysis for ordinal logistic regression
11.8 Achievement 5: Estimating and interpreting an ordinal logistic regression model
11.9 Achievement 6: Checking assumptions for ordinal logistic regression
11.10 Chapter summary
GLOSSARY
REFERENCES
INDEX
Sobre el autor
Jenine K. Harris earned her doctorate in public health studies and biostatistics from Saint Louis University School of Public Health in 2008. Currently, she teaches biostatistics courses as an Associate Professor in the Brown School public health program at Washington University in St. Louis. In 2013, she authored An Introduction to Exponential Random Graph Modeling, which was published in the Sage Quantitative Applications in the Social Sciences series and is accompanied by the ergmharris R package available on the Comprehensive R Archive Network (CRAN). She is an author on more than 80 peer-reviewed publications, and developed and published the odds.n.ends R package available on the CRAN. She is the leader of R-Ladies St. Louis, which she co-founded with Chelsea West in 2017 (@rladiesstl). R-Ladies St. Louis is a local chapter of R-Ladies Global (@rladiesglobal), an organization devoted promoting gender diversity in the R community. Her recent research interests focus on improving the quality of research in public health by using reproducible research practices throughout the research process.


