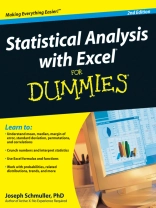
You too can understand the statistics of life, even if you’remath-challenged!
What do you need to calculate? Manufacturing output? A curve fortest scores? Sports stats? You and Excel can do it, and thisnon-intimidating guide shows you how. It demystifies the differenttypes of statistics, how Excel functions and formulas work, themeaning of means and medians, how to interpret your figures, andmore — in plain English.
* Getting there — learn how variables, samples, andprobability are used to get the information you want
* Excel tricks — find out what’s built into the program tohelp you work with Excel formulas
* Playing with worksheets — get acquainted with the worksheetfunctions for each step
* Graphic displays — present your data as pie graphs, bargraphs, line graphs, or scatter plots
* What’s normal? — understand normal distribution andprobability
* Hyping hypotheses — learn to use hypothesis testing withmeans and variables
* When regression is progress — discover when and how to useregression for forecasting
* What are the odds — work with probability, randomvariables, and binomial distribution
Open the book and find:
* Ten statistical and graphical tips and traps
* The difference between descriptive and inferentialstatistics
* Why graphs are good
* How to measure variations
* What standard scores are and why they’re used
* When to use two-sample hypothesis testing
* How to use correlations
* Different ways of working with probability
Table des matières
Introduction.
Part I: Statistics and Excel: A Marriage Made in Heaven.
Chapter 1: Evaluating Data in the Real World.
Chapter 2: Understanding Excel’s Statistical Capabilities.
Part II: Describing Data.
Chapter 3: Show and Tell: Graphing Data.
Chapter 4: Finding Your Center.
Chapter 5: Deviating from the Average.
Chapter 6: Meeting Standards and Standings.
Chapter 7: Summarizing It All.
Chapter 8: What’s Normal?
Part III: Drawing Conclusions from Data.
Chapter 9: The Confi dence Game: Estimation.
Chapter 10: One-Sample Hypothesis Testing.
Chapter 11: Two-Sample Hypothesis Testing.
Chapter 12: Testing More Than Two Samples.
Chapter 13: Slightly More Complicated Testing.
Chapter 14: Regression: Linear and Multiple.
Chapter 15: Correlation: The Rise and Fall of Relationships.
Part IV: Working with Probability.
Chapter 16: Introducing Probability.
Chapter 17: More on Probability.
Chapter 18: A Career in Modeling.
Part V: The Part of Tens.
Chapter 19: Ten Statistical and Graphical Tips and Traps.
Chapter 20: Ten Things (Twelve, Actually) That Didn’t Fitin Any Other Chapter.
Appendix A: When Your Worksheet Is a Database.
Appendix B: The Analysis of Covariance.
Appendix C: Of Stems, Leaves, Boxes, Whiskers, and Smoothies.
Index.
A propos de l’auteur
Joseph Schmuller, Ph D, is a technical architect at Blue Cross-Blue Shield of Florida. A former member of the American Statistical Association, he has taught statistics at the undergraduate, honors undergraduate, and graduate levels, and has been honored with an award for excellence in teaching.


