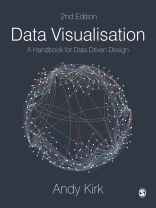
One of the ‘six best books for data geeks’ - Financial Times
With over 200 images and extensive how-to and how-not-to examples, this new edition has everything students and scholars need to understand and create effective data visualisations.
Combining ‘how to think’ instruction with a ‘how to produce’ mentality, this book takes readers step-by-step through analysing, designing, and curating information into useful, impactful tools of communication.
With this book and its extensive collection of online support, readers can:
- Decide what visualisations work best for their data and their audience using the chart gallery
- See data visualisation in action and learn the tools to try it themselves
- Follow online checklists, tutorials, and exercises to build skills and confidence
- Get advice from the UK’s leading data visualisation trainer on everything from getting started to honing the craft.
Jadual kandungan
INTRODUCTION
PART A FOUNDATIONS
Chapter 1 Defining Data Visualisation
Chapter 2 The Visualisation Design Process
PART B THE HIDDEN THINKING
Chapter 3 Formulating Your Brief
Chapter 4 Working With Data
Chapter 5 Establishing Your Editorial Thinking
PART C DESIGN THINKING
Chapter 6 Data Representation
Chapter 7 Interactivity
Chapter 8 Annotation
Chapter 9 Colour
Chapter 10 Composition
EPILOGUE
Mengenai Pengarang
Andy Kirk is an Independent Data Visualisation Expert delivering a range of professional services to clients around the world as a data visualisation design consultant and prolific trainer. He is a sought-after speaker, a four-times published author, the editor of visualisingdata.com, and host of the ‘Explore Explain’ video and podcast series. He’s had over a decade experience as an adjunct lecturer positions teaching data visualisation modules on Masters programmes at a range of esteemed institutes and maintains academic activity through involvement as an external research consultant. Before finding his calling with data visualisation Andy studied at Lancaster University, graduating in 1999 with a BSc (hons) in Operational Research then commenced his working career with a series of business analysis/information management roles with organisations including CIS Insurance, West Yorkshire Police and the University of Leeds. It was whilst working at the University that he had the opportunity to undertake a Masters of Research degree (MRes) to study data visualisation, graduating with distinction in 2009 and changing the course of his career.


