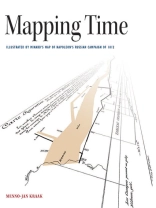
Mapping Time: Illustrated by Minard’s Map of Napoleon’s Russian Campaign of 1812 considers the cartographic challenge of visualizing time on a map. Inspired by graphic innovator Charles Minard’s classic map of France’s disastrous invasion of Russia, this book combines historical and geographic analysis with cartographic visualizations of mapping change over time. It includes more than 100 full-color illustrations.
Jadual kandungan
Preface Introduction: Maps tell time 1 Napoleon’s Russian campaign About Gerrit Janz Kraak 2 Minard’s map 2.1The map About Minard 2.2 Minard’s work 2.3 Mapping 1812 As a historical event Inspired by Minard Curiosities 3 Time 3.1 What about time? 3.2 Types of time 3.3 Events and change 3.4 Questions and time 3.5 Temporal data visualization and time-space 4 Maps, data, and design 4.1 Map basics 4.2 Map data analysis 4.3 Map design 5 Maps and time 5.1 Map narrative 5.2 Expressing change Change from object perspective Change from attribute perspective Change from location perspective Change and Minard’s representation of Napoleon’s Russian campaign Change and the map background 5.3 Change in a single map Flow line maps Cartograms Space time cube A third dimension 5.4 Change in a series of maps 5.5 Change in animation 6 Maps and temporal exploration 6.1 From presentation to exploration Mapping environment Representation Design guidelines Visualization strategies 6.2 Exploring Reviewing Napoleon’s battle record What happened at the crossing of the Berezina River? 7 Reflection References Credits Index
Mengenai Pengarang
Menno-Jan Kraak is professor of geovisual analytics and cartography in the department of geoinformation science and earth observation (ITC), University of Twente, The Netherlands. He has written more than 200 publications on cartography and GIS, most notably, with Ormeling, the textbook Cartography, Visualization of Geospatial Data (Pearson Education, 2010), which has been translated into five languages.


