Want to get started with impressive interactive visualizations and implement them in your daily tasks? This book offers the perfect solution-D3.js. It has emerged as the most popular tool for data visualization.
This book will teach you how to implement the features of the latest version of D3 while writing Java Script using the newest tools and technique
You will start by setting up the D3 environment and making your first basic bar chart. You will then build stunning SVG and Canvas-based data visualizations while writing testable, extensible code, as accurate and informative as it is visually stimulating. Step-by-step examples walk you through creating, integrating, and debugging different types of visualization and will have you building basic visualizations (such as bar, line, and scatter graphs) in no time.
By the end of this book, you will have mastered the techniques necessary to successfully visualize data and will be ready to use D3 to transform any data into an engaging and sophisticated visualization.
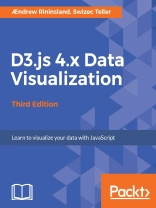
Aendrew Rininsland & Swizec Teller
D3.js 4.x Data Visualization [EPUB ebook]
Learn to visualize your data with JavaScript
D3.js 4.x Data Visualization [EPUB ebook]
Learn to visualize your data with JavaScript
Compre este e-book e ganhe mais 1 GRÁTIS!
Língua Inglês ● Formato EPUB ● Páginas 308 ● ISBN 9781787128156 ● Tamanho do arquivo 15.9 MB ● Editora Packt Publishing ● Cidade Brookland ● País US ● Publicado 2017 ● Carregável 24 meses ● Moeda EUR ● ID 5390631 ● Proteção contra cópia sem


