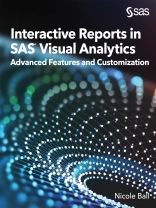
Elevate your reports with more user control and interactive elements
Want to create exciting, user-friendly visualizations to bring greater intelligence to your organization? By mastering the full power of SAS Visual Analytics, you can add features that will enhance your reports and bring more depth and insight to your data. Interactive Reports in SAS Visual Analytics: Advanced Features and Customization is for experienced users who want to harness the advanced functionality of Visual Analytics on SAS Viya to create visualizations or augment existing reports. The book is full of real-world examples and step-by-step instructions to help you unlock the full potential of your reports.
In this book, you will learn how to
- create interactive URL links to external websites
- use parameters to give the viewer more control
- add custom graphs and maps
- execute SAS code using SAS Viya jobs
- and more!
Sobre o autor
Nicole Ball, a Principal Technical Training Consultant at SAS, teaches courses on SAS Visual Analytics, SAS Data Quality, and the SAS programming language. Nicole is also a course developer for SAS Visual Analytics, which includes writing and updating courses and preparing customized training. Before coming to SAS, Nicole was an Economic Analyst at the Federal Reserve where she learned more about SAS code and how to apply it to real-world problems. She has a MS in Economics from the University of Texas at Dallas and a BA in Economics from Trinity University in San Antonio, TX.
When she’s not learning about new features in SAS software and trying to come up with neat solutions to student questions, Nicole loves to crochet and design stuffed animals, read fiction books of any kind, and do Cross Fit. Nicole currently lives in Celina, TX with her husband, Keith, and their dog, Winston.


