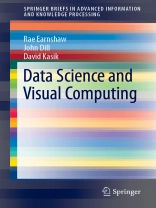
Data science addresses the need to extract knowledge and information from data volumes, often from real-time sources in a wide variety of disciplines such as astronomy, bioinformatics, engineering, science, medicine, social science, business, and the humanities. The range and volume of data sources has increased enormously over time, particularly those generating real-time data. This has posed additional challenges for data management and data analysis of the data and effective representation and display. A wide range of application areas are able to benefit from the latest visual tools and facilities. Rapid analysis is needed in areas where immediate decisions need to be made. Such areas include weather forecasting, the stock exchange, and security threats. In areas where the volume of data being produced far exceeds the current capacity to analyze all of it, attention is being focussed how best to address these challenges.
Optimum ways ofaddressing large data sets across a variety of disciplines have led to the formation of national and institutional Data Science Institutes and Centers. Being driven by national priority, they are able to attract support for research and development within their organizations and institutions to bring together interdisciplinary expertise to address a wide variety of problems. Visual computing is a set of tools and methodologies that utilize 2D and 3D images to extract information from data. Such methods include data analysis, simulation, and interactive exploration. These are analyzed and discussed.
Содержание
Data Science.- Big Data.- Visual Computing.- Visualization.- Geometric Visualization.- Visual Analytics.- Data Science Institutes and Data Centers.
Об авторе
Professor Rae Earnshaw
Rae Earnshaw is Professor of Electronic Imaging at the University of Bradford, UK since 1995 (now Emeritus). He gained his Ph D at the University of Leeds and is a chartered engineer and chartered information technology professional. He was Dean of the School of Informatics (1999-2007) and Pro Vice-Chancellor (Strategic Systems Development) (2004-09). He has been a Visiting Professor at Illinois Institute of Technology, George Washington University, USA, and Northwestern Polytechnical University, China. He is a member of ACM, IEEE, CGS, and a Fellow of the British Computer Society and the Institute of Physics. He has authored and edited 40 books on computer graphics, visualization, multimedia, design, and virtual reality, and published over 200 papers in these areas. Book publishers include: Addison Wesley, Springer, Academic Press, Cambridge University Press, IEEE Computer Society Press, and John Wiley & Sons Inc. Although playing a significant role in academic leadership and management over the past 20 years, he has maintained his research and publication record. He is a member of the Centre for Visual Computing at the University of Bradford which performs world-class research and development in the area of visual image data processing.
Professor John Dill
Professor Emeritus John Dill came to Simon Fraser University (SFU), Canada, from a senior position in industry in 1987. He joined the School of Interactive Arts and Technology from SFU’s School of Engineering Science in 2005, has worked in Computer Graphics, Computer-Aided Design, Information Visualization, Human-Computer Interaction and, most recently, Visual Analytics (VA). Dill was a member of the US National Visual Analytics Center panel that defined VA and developed the “VA Bible” Illuminating the Path. With colleagues Fisher, Darvill, Popowich and Rensink, he initiated efforts to establish VA in Canada, and, using a directed gift from The Boeing Company, established the SFU-based Vancouver Institute for Visual Analytics, a joint Simon Fraser University/University of British Columbia effort. VIVA has since established a national center, CANVAC, and an industrial consortium, VARDEC, mandated to fund and conduct applied VA research in Canada. His primary VA research has been co-developing (with Rob Woodbury and Chris Shaw) the CZSaw text analytics system. He received the IEEE Computer Society 2016 Visualization Career Award.
Mr David J. Kasik
David Kasik retired as Boeing’s Senior Technical Fellow in visualization and interactive techniques. He developed computer-aided design software, 3D viewing software, and pioneered the use of visual analytics. His work in CAD led to efficient ways to generate non-uniform rational b-spline surfaces and solids. The viewing software led to massive model visualization systems that let people view over a billion geometric polygonson commodity software. Visual analytics helps extract more information from complex non-geometric data. All three capabilities are applied across the complete product lifecycle, areas as diverse as safety and marketing. Dave earned his Masters degree in Computer Science from the University of Colorado in 1972 and a Bachelor’s in Quantitative Studies from the Johns Hopkins University in 1970. He is an ACM Fellow, an IEEE Distinguished Scientist, and stays involved in professional activities with both ACM and IEEE. In 2012 he received the ACM SIGGRAPH Outstanding Service Award.
