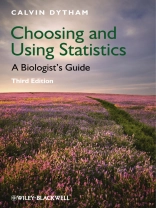
Choosing and Using Statistics remains an invaluable guide
for students using a computer package to analyse data from research
projects and practical class work. The text takes a pragmatic
approach to statistics with a strong focus on what is actually
needed. There are chapters giving useful advice on the basics
of statistics and guidance on the presentation of data. The book is
built around a key to selecting the correct statistical test and
then gives clear guidance on how to carry out the test and
interpret the output from four commonly used computer packages:
SPSS, Minitab, Excel, and (new to this edition) the free program,
R. Only the basics of formal statistics are described and the
emphasis is on jargon-free English but any unfamiliar words can be
looked up in the extensive glossary. This new 3rd
edition of Choosing and Using Statistics is a must for all
students who use a computer package to apply statistics in
practical and project work.
Features new to this edition:
* Now features information on using the popular free program,
R
* Uses a simple key and flow chart to help you choose the right
statistical test
* Aimed at students using statistics for projects and in
practical classes
* Includes an extensive glossary and key to symbols to explain
any statistical jargon
* No previous knowledge of statistics is assumed
สารบัญ
Preface.
1 Eight steps to successful data analysis.
2 The basics.
Observations.
Hypothesis testing.
P-values.
Sampling.
Experiments.
Statistics.
3 Choosing a test: a key.
Remember: eight steps to successful data analysis.
The art of choosing a test.
A key to assist in your choice of statistical test.
4 Hypothesis testing, sampling and experimental design.
Hypothesis testing.
Acceptable errors.
P-values.
Sampling.
Experimental design.
5 Statistics, variables and distributions.
What are statistics?
Types of statistics.
What is a variable?
Types of variables or scales of measurement.
Types of distribution.
Discrete distributions.
Continuous distributions.
Non-parametric ‘distributions’.
6 Descriptive and presentational techniques.
General advice.
Displaying data: summarizing a single variable.
Displaying data: showing the distribution of a single variable.
Descriptive statistics.
Using the computer packages.
Displaying data: summarizing two or more variables.
Displaying data: comparing two variables.
Displaying data: comparing more than two variables.
7 The tests 1: tests to look at differences.
Do frequency distributions differ?
Do the observations from two groups differ?
Do the observations from more than two groups differ?
There are two independent ways of classifying the data.
More than one observation for each factor combination (with replication).
There are more than two independent ways to classify the data.
Not all classifications are independent.
Nested or hierarchical designs.
8 The tests 2: tests to look at relationships.
Is there a correlation or association between two variables?
Is there a cause-and-effect relationship between two variables?
Tests for more than two variables.
9 The tests 3: tests for data exploration.
Types of data.
Observation, inspection and plotting.
Symbols and letters used in statistics.
Greek letters.
Symbols.
Upper-case letters.
Lower-case letters.
Glossary.
Assumptions of the tests.
Hints and tips.
A table of statistical tests.
Index.
เกี่ยวกับผู้แต่ง
Calvin Dytham has a wide range of research interests in ecology and evolutionary biology and is especially interested in the impacts of dispersal and the arrangement of individuals in space on ecological and evolutionary processes. He is a Reader in the Department of Biology at the University of York, UK, and has been teaching statistics to undergraduate and postgraduate students since 1994.


