Explore different perspectives and approaches to create more effective visualizations
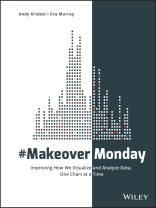
#Makeover Monday offers inspiration and a giant dose of perspective for those who communicate data. Originally a small project in the data visualization community, #Makeover Monday features a weekly chart or graph and a dataset that community members reimagine in order to make it more effective. The results have been astounding; hundreds of people have contributed thousands of makeovers, perfectly illustrating the highly variable nature of data visualization. Different takes on the same data showed a wide variation of theme, focus, content, and design, with side-by-side comparisons throwing more- and less-effective techniques into sharp relief.
This book is an extension of that project, featuring a variety of makeovers that showcase various approaches to data communication and a focus on the analytical, design and storytelling skills that have been developed through #Makeover Monday. Paging through the makeovers ignites immediate inspiration for your own work, provides insight into different perspectives, and highlights the techniques that truly make an impact.
* Explore the many approaches to visual data communication
* Think beyond the data and consider audience, stakeholders, and message
* Design your graphs to be intuitive and more communicative
* Assess the impact of layout, color, font, chart type, and other design choices
Creating visual representation of complex datasets is tricky. There’s the mandate to include all relevant data in a clean, readable format that best illustrates what the data is saying–but there is also the designer’s impetus to showcase a command of the complexity and create multidimensional visualizations that ‘look cool.’ #Makeover Monday shows you the many ways to walk the line between simple reporting and design artistry to create exactly the visualization the situation requires.
Зміст
Foreword ix
Acknowledgments xi
About the Authors xv
Part I
Introduction 3
What Is Makeover Monday? 3
How Did Makeover Monday Start? 4
The Community Project 7
Pillars of Makeover Monday 16
How to Use this book 29
Part II
Chapter 1 Habits of a Good Data Analyst 33
Approaching Unfamiliar Data 33
Analysis versus Visualization 44
Take Your Time 47
Build Context Through Additional Research 48
Find Insights 50
Communicate Clearly 54
Ask Questions 57
Summary 61
Chapter 2 Data Quality and Accuracy 63
Working with Incomplete Data 64
Overcounting Data 74
Sense-Checking Data 76
Is the Data Aggregable? 80
Substantiating Claims with Data 88
Summary 90
Chapter 3 Know and Understand the Data 91
Using Appropriate Aggregations 92
Explaining Metrics 109
Identifying and Correcting Mistakes 115
Time Series Analysis 119
Summary 133
Chapter 4 Keep It Simple 135
What Is Simplicity? 135
Simplicity in Design 136
Simplicity in Analysis 150
Simplicity in Storytelling 153
Summary 157
Chapter 5 Attention to Detail 159
Typos 161
Punctuation 162
Formatting 162
Crediting Images and Data Sources 182
Summary 183
Chapter 6 Designing for the Audience 185
Creating an Effective Design 186
Designing for Mobile 196
Using Visual Cues for Additional Information 207
Using Icons and Shapes 208
Storytelling 211
Reviewing Your Work to Improve Its Quality 216
Summary 218
Chapter 7 Trying New Things 219
Developing a Sharing Culture 221
Summary 235
Chapter 8 Iterate to Improve 237
Why Iterate? 237
Examples of Effective Iteration 241
Giving and Receiving Feedback 256
Summary 263
Chapter 9 Effective Use of Color 265
The Significance of Color in Data Visualization 266
Using Color to Evoke Emotions 267
Using Color to Create Associations 273
Using Color to Highlight 281
Best Practices for Using Color 283
Using Background Colors 287
Using Text as a Color Legend 291
Summary 294
Chapter 10 Choosing the Right Chart Type 295
Area Charts 296
Stacked Bar Charts 299
Diverging Bar Charts 304
Filled Maps 309
Donut and Pie Charts 318
Packed Bubble Charts 325
Treemaps 331
Slopegraphs 338
Connected Scatterplots 345
Circular Histograms 353
Radial Bar Charts 360
Resources 366
Summary 366
Chapter 11 Effective Use of Text 367
Effective Titles and Subtitles 367
What Is Your Key Message? 377
Instructions and Explanations 386
Summary 398
Chapter 12 Using Context to Inform 399
The Importance of Context 400
Using Simple Metrics 402
Methods for Communicating Context 418
Summary 428
Part III
The Community 431
Long-Term Contributors 431
Educators 446
Employers 446
Organizations 447
Nonprofits 448
Social Impact 448
Makeover Monday Live Events 449
Makeover Monday Enterprise Edition 450
Source Lines 453
Index 457
Про автора
ANDY KRIEBEL is Head Coach at The Information Lab Data School and a member of the Tableau Zen Master Hall of Fame. The Makeover Monday series originated from his blog at vizwiz.com, where he shares data visualization tips, tricks, and best practices.
EVA MURRAY is the Head of Business Intelligence at Exasol, a Tableau Ambassador, and a 2018 Tableau Zen Master. She has co-hosted Makeover Monday since 2017, and blogs about Tableau, travel, and triathlon at trimydata.com.


