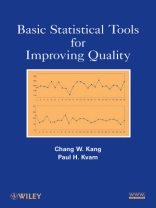
This book is an introductory book on improving the quality of a process or a system, primarily through the technique of statistical process control (SPC). There are numerous technical manuals available for SPC, but this book differs in two ways: (1) the basic tools of SPC are introduced in a no-nonsense, simple, non-math manner, and (2) the methods can be learned and practiced in an uncomplicated fashion using free software (e Z SPC 2.0), which is available to all readers online as a downloadable product. The book explains QC7 Tools, control charts, and statistical analysis including basic design of experiments. Theoretical explanations of the analytical methods are avoided; instead, results are interpreted through the use of the software.
Зміст
Preface.
1 The Importance of Quality Improvement.
1.1 Introduction.
1.2 What is Statistical Process Control?
1.3 The Birth of Quality Control.
1.4 What is a Process?
1.5 Examples of Processes from Daily Life.
1.6 Implementing the Tools and Techniques.
1.7 Continuous Process Improvement.
1.8 The Goal of Statistical Process Control.
1.9 The Eight Dimensions of Quality for Manufacturing &
Service.
1.10 The Cost of (Poor) Quality).
1.11 What Did We Learn?
1.12 Test Your Knowledge.
2 Graphical Display of Data.
2.1 Introduction to e Z SPC.
2.2 Qualitative and Quantitative Data.
2.3 Bar Graph.
2.4 Pie Chart.
2.5 Pareto Chart.
2.6 Radar Chart.
2.7 Histogram.
2.8 Box Plot.
2.9 Scatter Plot.
2.10 Cause and E®ect Diagram.
2.11 What Did We Learn?
2.12 Test Your Knowledge.
Exercises.
3 Summarizing Data.
3.1 Central Tendency.
3.2 Variability.
3.3 Statistical Distributions.
3.4 Distributions in e Z SPC.
3.5 What Did We Learn?
3.6 Test Your Knowledge.
Exercises.
4 Analyzing Data.
4.1 Confidence Intervals.
4.2 Test of Hypothesis.
4.3 The p-value.
4.4 Probability Plots.
4.5 What Did We Learn?
4.6 Test Your Knowledge.
Exercises.
5 Shewhart Control Charts.
5.1 The Concepts of a Control Chart.
5.2 Managing the Process with Control Charts.
5.3 Variable Control Charts.
5.4 Attribute Control Charts.
5.5 Deciding Which Chart to Use.
5.6 What Did We Learn?
5.7 Test Your Knowledge.
Exercises.
6 Advanced Control Charts.
6.1 CUSUM Control Chart.
6.2 EWMA Control Charts.
6.3 CV Control Chart.
6.4 Nonparametric Control Charts.
6.5 Process Capability.
6.6 Gage R & R.
6.7 What Did We Learn?
6.8 Test Your Knowledge.
Exercises.
7 Process Improvement.
7.1 Correlation Analysis.
7.2 Regression Analysis.
7.3 Experimental Design.
7.4 Overview of Experimental Design.
7.5 Principles of Experimentation.
7.6 One-Way Analysis of Variance .
7.7 Two Way Analysis of Variance.
7.8 Two-level Factorial Design Analysis.
7.9 What Did We Learn?
7.10 Test Your Knowledge.
Exercises.
8 End Material.
8.1 Final Exam.
8.2 Final Exam Solutions.
8.3 Test Your Knowledge: Answers.
References.
Glossary.
Subject Index.
Про автора
Chang W. Kang, Ph D, is Professor in the Department of
Industrial and Management Engineering at Hanyang University (South
Korea). He has published extensively in the areas of engineering
statistics, statistical quality control, and quality management.
Former president of the Korea Society of Industrial and Systems
Engineering, Dr. Kang is the recipient of both the President’s
Award (2004) and the Medal of Service Merits (2007) by the Korean
government.
Paul H. Kvam, Ph D, is Professor of Industrial and Systems
Engineering at the Georgia Institute of Technology. He has
published numerous papers in the areas of statistical reliability
with applications to engineering, nonparametric estimation, and
analysis of complex and dependent systems. He is a Fellow of the
American Statistical Association and the coauthor of
Nonparametric Statistics for Science and Engineering
(Wiley).
