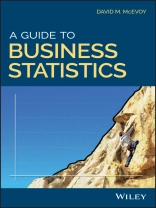
An accessible text that explains fundamental concepts in business statistics that are often obscured by formulae and mathematical notation
A Guide to Business Statistics offers a practical approach to statistics that covers the fundamental concepts in business and economics. The book maintains the level of rigor of a more conventional textbook in business statistics but uses a more stream-lined and intuitive approach. In short, A Guide to Business Statistics provides clarity to the typical statistics textbook cluttered with notation and formulae.
The author–an expert in the field–offers concise and straightforward explanations to the core principles and techniques in business statistics. The concepts are intro-duced through examples, and the text is designed to be accessible to readers with a variety of backgrounds. To enhance learning, most of the mathematical formulae and notation appears in technical appendices at the end of each chapter. This important resource:
* Offers a comprehensive guide to understanding business statistics targeting business and economics students and professionals
* Introduces the concepts and techniques through concise and intuitive examples
* Focuses on understanding by moving distracting formulae and mathematical notation to appendices
* Offers intuition, insights, humor, and practical advice for students of business statistics
* Features coverage of sampling techniques, descriptive statistics, probability, sampling distributions, confidence intervals, hypothesis tests, and regression
Written for undergraduate business students, business and economics majors, teachers, and practitioners, A Guide to Business Statistics offers an accessible guide to the key concepts and fundamental principles in statistics.
Зміст
Dedication
Preface
0.1. Addressing two challenges
0.2. How to use this book
0.3. Target audience
Chapter 1: Types of Data
1.1. Categorical data
1.2. Numerical data
1.3. Level of measurement
1.4. Cross-sectional, time-series and panel data
1.5. Summary
Chapter 2: Populations and Samples
2.1. What is the population of interest?
2.2. How to sample from a population?
2.3. Getting the data
2.4. Summary
Chapter 3: Descriptive Statistics
3.1. Measures of central tendency
3.2. Measures of variability
3.3. The shape
3.4. Summary
Technical Appendix
Chapter 4: Probability
4.1. Simple probabilities
4.2. Empirical probabilities
4.3. Conditional probabilities
4.4. Summary
Technical Appendix
Chapter 5: The Normal Distribution
5.1. The bell shape
5.2. The Empirical Rule
5.3. Standard normal distribution
5.4. Normal approximations
5.5. Summary
Technical Appendix
Chapter 6: Sampling Distributions
6.1. Defining a sampling distribution
6.2. The importance of sampling distributions
6.3. An example of a sampling distribution
6.4. Characteristics of a sampling distribution of a mean
6.5. Sampling distribution of a proportion
6.6. Summary
Technical Appendix
Chapter 7: Confidence Intervals
7.1. Confidence intervals for means
7.2. Confidence intervals for proportions
7.3. Sample size and the width of confidence intervals
7.4. Comparing two proportions from the same poll
7.5. Summary
Technical Appendix
Chapter 8: Hypothesis Tests of a Population Mean
8.1. Two-tail hypothesis test of a mean
8.2. One-tail hypothesis test of a mean
8.3. p-value approach to hypothesis tests
8.4. Summary
Technical Appendix
Chapter 9: Hypothesis Tests of Categorical Data
9.1. Two-tail hypothesis test of a proportion
9.2. One-tail hypothesis test of a proportion
9.3. Using p-values
9.4. Chi-square tests
9.5. Summary
Technical Appendix
Chapter 10: Hypothesis Tests Comparing Two Parameters
10.1. The approach in this chapter
10.2. Hypothesis tests of two means
10.3. Hypothesis tests of two variances
10.4. Hypothesis tests of two proportions
10.5. Summary
Technical Appendix
Chapter 11: Simple Linear Regression
11.1. The population regression model
11.2. A look at the data
11.3. Ordinary Least Squares (OLS)
11.4. The distribution of b0 and b1
11.5. Tests of significance
11.6. Goodness of fit
11.7. Checking for violations of the assumptions
11.8. Summary
Technical Appendix
Chapter 12: Multiple Regression
12.1. Population regression model
12.2. The data
12.3. Sample regression function
12.4. Interpreting the estimates
12.5. Prediction
12.6. Tests of significance
12.7. Goodness of fit
12.8. Multicollinearity
12.9. Summary
Technical Appendix
Chapter 13: More Topics in Regression
13.1. Hypothesis tests comparing two means with regression
13.2. Hypothesis tests comparing more than two means (ANOVA)
13.3. Interacting variables
13.4. Non-linearities
13.5. Time-series analysis
13.6. Summary
Index
Про автора
DAVID M. MCEVOY, PHD, is an Associate Professor in the Economics Department at Appalachian State University in Boone NC. He has published over 20 peer-reviewed articles and is coeditor of two books. Dr. Mc Evoy is an award-winning educator who has taught undergraduate courses in business statistics for over 10 years.
