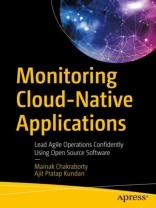
Introduce yourself to the nuances of modern monitoring for cloud-native applications running on Kubernetes clusters. This book will help you get started with the concepts of monitoring, introduce you to popular open-source monitoring tools, and help with finding the correct set of use cases for their implementation. It covers the in-depth technical details of open-source software used in modern monitoring systems that are tailor made for environments running microservices.
Monitoring Cloud-Native Applications is divided into two parts. Part 1 starts with an introduction to cloud-native applications and the foundational concepts of monitoring. It then walks you through the various aspects of monitoring containerized workloads using Kubernetes as the de-facto orchestration platform. You will dive deep into the architecture of a modern monitoring system and look at its individual components in detail.
Part 2 introduces you to popular open-source tools which are usedby enterprises and startups alike and are well established as the tools of choice for industry stalwarts. First off, you will look at Prometheus and understand its architecture and usage. You will also learn about Influx DB, formerly called TICK Stack (Telegraf, Influx DB, Chronograf, and Kapacitor). You will explore the technical details of its architecture and the use cases which it solves. In the next chapter, you will be introduced to Grafana, a multi-platform open source analytics and interactive visualization tool that can help you with visualization of data and dashboards.
What You Will Learn
Monitor and observe of metrics, events, logs, and traces
Carry out infrastructure and application monitoring for microservices architecture
Analyze and visualize collected data
Use alerting, reporting, and automated actions for problem resolution
Who This Book Is For
Dev Ops administrators, cloud administrators, and site reliability engineers (SREs) who manage and monitor applications and cloud infrastructure on a day-to-day basis within their organizations.
Зміст
Ch1: Basic concepts of Monitoring.- Ch 2: Collection of Events, Logs and Metrics.- Ch 3: Architecture of a Modern Monitoring System.- Ch 4: Prometheus.- Ch 5: TICK Platform.- Ch 6: Elastic Stack – Elastic Search.- Ch 7: Analyze and Investigate.- Ch 8: Type of Time Series Graphs.- Ch 9: Type of Summary Graphs.- Ch 10: Graphana.- Ch 11: Alerting and Notifications.
Про автора
Mainak Chakraborty works as a senior solutions architect at a leading public cloud company, specializing in cloud management and automation tools. He has been instrumental in shaping the cloud journey of customers across industry segments whether they be established enterprises or born-in-the-cloud startups. Mainak is an open source enthusiast and regularly presents at industry technical events on his favorite topics of automation, cloud native applications, and cloud computing.
Ajit Pratap Kundan stands at the leading edge of the innovative technologies of todays’ information technology world. He’s worked with HPE, VMware, Novell, Redington, and PCS and helped their customers in transforming their datacenters through software-defined services. Ajit is a valued author on cloud technologies and has authored two books VMware Cross-Cloud Architecture and Intelligent Automation with VMware publishedby Packt and has reviewed one book Deep Learning with Pytorch.


