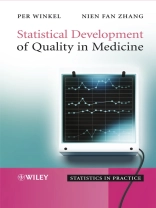
The promotion of standards and guidelines to advance quality
assurance and control is an integral part of the health care
sector. Quantitative methods are needed to monitor, control and
improve the quality of medical processes.
Statistical Development of Quality in Medicine presents
the statistical concepts behind the application of industrial
quality control methods. Filled with numerous case studies and
worked examples, the text enables the reader to choose the relevant
control chart, to critically apply it, improve it if necessary, and
monitor its stability. Furthermore, the reader is provided with the
necessary background to critically assess the literature on the
application of control charts and risk adjustment and to apply the
findings.
* Contains a user-friendly introduction, setting out the
necessary statistical concepts used in the field.
* Uses numerous real-life case studies from the literature and
the authors’ own research as the backbone of the text.
* Provides a supplementary website featuring problems and answers
drawn from the book, alongside examples in Statgraphics.
The accessible style of Statistical Development of in
Clinical Medicine invites a large readership. It is primarily
aimed at health care officials, and personnel responsible for
developing and controlling the quality of health care services.
However, it is also ideal for statisticians working with health
care problems, diagnostic and pharmaceutical companies, and
graduate students of quality control.
Зміст
Preface.
Acknowledgements.
Introduction – on quality of health care in
general.
I.1 Quality of health care.
I.2 Measures and indicators of quality of health care.
I.3 The functions of quality measures and indicators.
References.
Part I Control Charts.
1 Theory of statistical process control.
1.1 Statistical foundation of control charts.
1.2 Use of control charts.
1.3 Design of control charts.
1.4 Rational samples.
1.5 Analysing the properties of a control chart.
1.6 Checklists and Pareto charts.
1.7 Clinical applications of control charts.
1.8 Inappropriate changes of a process.
References.
2 Shewhart control charts.
2.1 Control charts for discrete data.
2.2 Control charts for continuous data.
2.3 Control charts for variable sample size.
References.
3 Time-weighted control charts.
3.1 Shortcomings of Shewhart charts.
3.2 Cumulative sum charts.
3.3 Exponentially weighted moving average (EWMA) charts.
References.
4 Control charts for autocorrelated data.
4.1 Time series analysis.
4.2 Tests of independence of measurements.
4.3 Control charts for autocorrelated data.
4.4 Effect of choice of process standard deviation
estimator.
References.
Part II Risk Adjustment.
5 Tools for risk adjustment.
5.1 Variables.
5.2 Statistical models.
5.3 Regression on continuous outcome measure.
5.4 Logistic regression on binary data.
5.5 Assessing the quality of a regression model.
References.
6 Risk-adjusted control charts.
6.1 Risk adjustment.
6.2 Risk-adjusted control charts.
6.3 Comments.
References.
7 Risk-adjusted comparison of healthcare providers.
7.1 Experimental adjustment.
7.2 Statistical risk adjustment of observational data.
7.3 Perils of risk adjusting observational data.
7.4 Public report cards.
References.
Part III Learning and Quality Assessment.
8 Learning curves.
8.1 Assessing a single learning curve.
8.2 Assessing multiple learning curves.
8.3 Factors affecting learning curves.
8.4 Learning curves and randomised clinical trials.
References.
9 Assessing the quality of clinical processes.
9.1 Data processing requirement.
9.2 Benchmarking of processes in statistical control.
9.3 Dealing with processes that are not in statistical control
in the same state.
9.4 Overdispersion.
9.5 Multiple significance testing.
References.
Appendix A – Basic statistical concepts.
A.1 An example of random sampling.
A.2 Data.
A.3 Probability distributions.
A.4 Using the data.
References.
Appendix B – X and S chart with variable sample
size.
Appendix C – Moving range estimator of the standard
deviation of an AR (1) process.
References.
Index.
Про автора
Per Winkel – Senior researcher at the Copenhagen Trial Unit,
Centre for Clinical Intervention Research at the University
Hospital of Copenhagen. Professor Winkel has worked in this field
for 40 years, with over a decade’s teaching experience. He
has contributed to several international textbooks, has published a
Danish textbook in 2002, and published over 150 papers in
international journals.
Niew Fan Zhang – Manager of Metrology Statistics
and Computation Group, Statistical Engineering Division, US
National Institute of Standards and Technology. Dr Zhang has thirty
years experience in the field, in both teaching and research. He
has published over 50 papers in various international journals, and
has won numerous awards for engineering achievements and
statistical research.


