A fresh look at visualization from the author of Visualize This
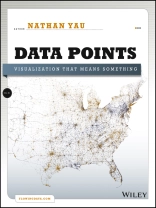
Whether it’s statistical charts, geographic maps, or the snappy graphical statistics you see on your favorite news sites, the art of data graphics or visualization is fast becoming a movement of its own. In Data Points: Visualization That Means Something, author Nathan Yau presents an intriguing complement to his bestseller Visualize This, this time focusing on the graphics side of data analysis. Using examples from art, design, business, statistics, cartography, and online media, he explores both standard-and not so standard-concepts and ideas about illustrating data.
- Shares intriguing ideas from Nathan Yau, author of Visualize This and creator of flowingdata.com, with over 66, 000 subscribers
- Focuses on visualization, data graphics that help viewers see trends and patterns they might not otherwise see in a table
- Includes examples from the author’s own illustrations, as well as from professionals in statistics, art, design, business, computer science, cartography, and more
- Examines standard rules across all visualization applications, then explores when and where you can break those rules
Create visualizations that register at all levels, with Data Points: Visualization That Means Something.
Mục lục
Introduction xi
1 Understanding Data 1
What Data Represents 2
Variability 20
Uncertainty 30
Context 35
Wrapping Up 41
2 Visualization: The Medium 43
Analysis and Exploration 45
Information Graphics and Presentation 58
Entertainment 69
Data Art 74
The Everyday 81
Wrapping Up 89
3 Representing Data 91
Visualization Components 93
Putting It Together 115
Wrapping Up 132
4 Exploring Data Visually 135
Process 136
Visualizing Categorical Data 143
Visualizing Time Series Data 154
Visualizing Spatial Data 165
Multiple Variables 176
Distributions 193
Wrapping Up 199
5 Visualizing with Clarity 201
Visual Hierarchy 202
Readability 205
Highlighting 221
Annotation 228
Do the Math 236
Wrapping Up 239
6 Designing for an Audience 241
Common Misconceptions 242
Present Data to People 254
Things to Consider 258
Putting It Together 268
Wrapping Up 273
7 Where to Go from Here 277
Visualization Tools 278
Programming 283
Illustration 288
Statistics 289
Wrapping Up 289
Index 291
Giới thiệu về tác giả
Nathan Yau has a Ph D in statistics and is a statistical consultant who helps clients make use of their data through visualization. He created the popular site Flowing Data.com, and is the author of Visualize This: The Flowing Data Guide to Design, Visualization, and Statistics, also published by Wiley.


