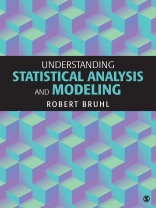
Understanding Statistical Analysis and Modeling is a text for graduate and advanced undergraduate students in the social, behavioral, or managerial sciences seeking to understand the logic of statistical analysis. Robert Bruhl covers all the basic methods of descriptive and inferential statistics in an accessible manner by way of asking and answering research questions. Concepts are discussed in the context of a specific research project and the book includes probability theory as the basis for understanding statistical inference. Instructions on using SPSS® are included so that readers focus on interpreting statistical analysis rather than calculations. Tables are used, rather than formulas, to describe the various calculations involved with statistical analysis and the exercises in the book are intended to encourage students to formulate and execute their own empirical investigations.
Table des matières
Introduction
Acknowledgments
About the Author
PART I. RESEARCH DESIGN
Purpose: Making Sense of What We Observe
Deciding How to Represent Properties of a Phenomenon
Describing Differences or Explaining Differences Between Phenomena?
Deciding How to Collect Observations
Chapter 1. “Why” Conduct Research, and “Why” Use Statistics?
1.0 Learning Objectives
1.1 Motivation
1.2 Representation and Modeling
1.3 A Special Case: Investigating Subjective Behavior
1.4 Reasons for an Empirical Investigation
1.5 Summary
1.6 Exercises
1.7 Some Formal Terminology (Optional)
Chapter 2. Methods of Quantitative Empirical Investigation
2.0 Learning Objectives
2.1 Motivation
2.2 Instrumentation: Choosing a Tool to Assess a Property of Interest
2.3 Limited Focus or Intent to Generalize
2.4 Controlled or Natural Observations
2.5 Applied Versus Pure Research
2.6 Summary
2.7 Exercises
PART II. DESCRIPTIVE STATISTICS
Organizing and Describing a Set of Observations
Measuring the Variability in a Set of Observations
Describing a Set of Observations in Terms of Their Variability
Chapter 3. The Frequency Distribution Report: Organizing a Set of Observations
3.0 Learning Objectives
3.1 Motivation: Comparing, Sorting, and Counting
3.2 Constructing a Sample Frequency Distribution for a “Qualitative” Property
3.3 Constructing a Sample Frequency Distribution for an “Ordinal” Property
3.4 Some Important Technical Notes
3.5 Summary
3.6 SPSS Tutorial
3.7 Exercises
Chapter 4. The Mode, the Median, and the Mean: Describing a Typical Value of a Quantitative Property Observed for a Set of Phenomena
4.0 Learning Objectives
4.1 Motivation
4.2 A Cautionary Note Regarding Quantitatively Assessed Properties
4.3 Constructing a Sample Frequency Distribution for a Quantitative Property
4.4 Identifying a Typical Phenomenon from a Set of Phenomena
4.5 Assessing and Using the Median of a Set of Observations
4.6 Assessing and Using the Mean of a Set of Observations
4.7 Interpreting and Comparing the Mode, the Median, and the Mean
4.8 Summary
4.9 SPSS Tutorial
4.10 Exercises
Chapter 5. The Variance and the Standard Deviation: Describing the Variability Observed for a Quantitative Property of a Set of Phenomena
5.0 Learning Objectives
5.1 Motivation
5.2 A Case Example: The Frequency Distribution Report
5.3 The Range of a Set of Observations
5.4 The Mean Absolute Difference
5.5 The Variance and the Standard Deviation
5.6 Interpreting the Variance and the Standard Deviation
5.7 Comparing the Mean Absolute Difference and the Standard Deviation
5.8 A Useful Note on Calculating the Variance
5.9 A Note on Modeling and the Assumption of Variability
5.10 Summary
5.11 SPSS Tutorial
5.12 Exercises
5.13 The Method of Moments (Optional)
5.14 A Distribution of “Squared Differences from a Mean” (Optional)
Chapter 6. The z-Transformation and Standardization: Using the Standard Deviation to Compare Observations
6.0 Learning Objectives
6.1 Motivation
6.2 Executing the z-Transformation
6.3 An Example
6.4 Summary
6.5 An Exercise
PART III. STATISTICAL INFERENCE AND PROBABILITY
Why Probability Theory?
The Concept of a Probability
Predicting Events Involving Two Coexisting Properties
Sampling and the Normal Probability Model
Chapter 7. The Concept of a Probability
7.0 Learning Objectives
7.1 Motivation
7.2 Uncertainty, Chance, and Probabilit
7.3 Selection Outcomes and Probabilities
7.4 Events and Probabilities
7.5 Describing a Probability Model for a Quantitative Property
7.6 Summary
7.7 Exercises
Chapter 8. Coexisting Properties and Joint Probability Models
8.0 Learning Objectives
8.1 Motivation
8.2 Probability Models Involving Coexisting Properties
8.3 Models of Association, Conditional Probabilities, and Stochastic Independence
8.4 Covariability in Two Quantitative Properties
8.5 Importance of Stochastic Independence and Covariance in Statistical Inference
8.6 Summary
8.7 Exercises
Chapter 9. Sampling and the Normal Probability Model
9.0 Learning Objectives
9.1 Motivation
9.2 Samples and Sampling
9.3 Bernoulli Trials and the Binomial Distribution
9.4 Representing the Character of a Population
9.5 Predicting Potential Samples from a Known Population
9.6 The Normal Distribution
9.7 The Central Limit Theorem
9.8 Normal Sampling Variability and Statistical Significance
9.9 Summary
9.10 Exercises
PART IV. TOOLS FOR MAKING STATISTICAL INFERENCES
Estimation Studies
Association Studies
Chapter 10. Estimation Studies: Inferring the Parameters of a Population from the Statistics of a Sample
10.0 Learning Objectives
10.1 Motivation
10.2 Estimating the Occurrence of a Qualitative Property for a Population
10.3 Estimating the Occurrences of a Quantitative Property for a Population
10.4 Some Notes on Sampling
10.5 SPSS Tutorial
10.6 Summary
10.7 Exercises
Chapter 11. Chi-Square Analysis: Investigating a Suspected Association Between Two Qualitative Properties
11.0 Learning Objectives
11.1 Motivation
11.2 An Example
11.3 An Extension: Testing the Statistical Significance of Population Proportions
11.4 Summary
11.5 SPSS Tutorial
11.6 Exercises
Chapter 12. The t-Test of Statistical Significance: Comparing a Quantitative Property Assessed for Two Different Groups
12.0 Learning Objectives
12.1 Motivation
12.2 An Example
12.3 Comparing Sample Means Using the Central Limit Theorem (Optional)
12.4 Comparing Sample Means Using the t-Test
12.5 Summary
12.6 SPSS Tutorial
12.7 Exercises
Chapter 13. Analysis of Variance: Comparing a Quantitative Property Assessed for Several Different Groups
13.0 Learning Objectives
13.1 Motivation
13.2 An Example
13.3 The F-Test
13.4 A Note on Sampling Distributions (Optional)
13.5 Summary
13.6 SPSS Tutorial
13.7 Exercises
Chapter 14. Correlation Analysis and Linear Regression: Assessing the Covariability of Two Quantitative Properties
14.0 Learning Objectives
14.1 Motivation
14.2 An Example
14.3 Visual Interpretation with a Scatter Plot (Optional)
14.4 Assessing an Association as a Covariance
14.5 Regression Analysis: Representing a Correlation as a Linear Mathematical Model
14.6 Assessing the Explanatory Value of the Model
14.7 Summary
14.8 SPSS Tutorial
14.9 Exercises
Index
A propos de l’auteur
Robert Bruhl is the author of the statistics textbook Understanding Statistical Analysis and Modeling for Sage (2018). He is currently Clinical Professor in the Department of Political Science, where his primary focus is on policy analysis and research design. Included in his specialties are economic history, voter behavior, and Congressional behavior. Most recently, he has focused his attention on political marketing and campaigns, and has presented papers on this subject both nationally and internationally. He has also contributed his expertise to both local, national, and international media. Prior to his appointment at UIC, he taught at De Paul University in their Public Service Graduate Program, and before entering the academic world, he enjoyed a fifteen-year career in the private sector, and held various positions in management consulting, marketing, and business planning. He has a B.A. degree (Phi Beta Kappa) in Mathematics from Northwestern University, an M.S. degree in Computer and Communication Sciences from the University of Michigan, an M.B.A. in Business Economics from the University of Chicago, and a Ph.D. (Phi Kappa Phi) in Public Policy Analysis from the University of Illinois at Chicago. He is currently at work on a book describing the political and economic development of the English-American Colonies, with a focus on the effect this development had on the U.S. Constitution.


