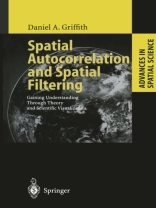
Exploiting the old maxim that "a picture is worth a thousand words, " scientific visualization may be defined as the transformation of numerical scientific data into informative graphical displays. It introduces a nonverbal model into subdisciplines that hitherto employed mostly or only mathematical or verbal-conceptual models. The focus of this monograph is on how scientific visualization can help revolutionize the manner in which the tendencies for (dis)similar numerical values to cluster together in location on a map are explored and analyzed, affording spatial data analyses that are better understood, presented, and used. In doing so, the concept known as spatial autocorrelation – which characterizes these tendencies and is one of the key features of georeferenced data, or data tagged to the earth’s surface – is further de-mystified. This self-correlation arises from relative locations in geographic space.
Daniel A. Griffith
Spatial Autocorrelation and Spatial Filtering [PDF ebook]
Gaining Understanding Through Theory and Scientific Visualization
Spatial Autocorrelation and Spatial Filtering [PDF ebook]
Gaining Understanding Through Theory and Scientific Visualization
ซื้อ eBook เล่มนี้และรับฟรีอีก 1 เล่ม!
ภาษา อังกฤษ ● รูป PDF ● ISBN 9783540248064 ● สำนักพิมพ์ Springer Berlin Heidelberg ● การตีพิมพ์ 2013 ● ที่สามารถดาวน์โหลดได้ 3 ครั้ง ● เงินตรา EUR ● ID 6315865 ● ป้องกันการคัดลอก Adobe DRM
ต้องใช้เครื่องอ่านหนังสืออิเล็กทรอนิกส์ที่มีความสามารถ DRM
