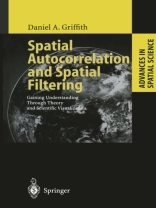
Exploiting the old maxim that "a picture is worth a thousand words, " scientific visualization may be defined as the transformation of numerical scientific data into informative graphical displays. It introduces a nonverbal model into subdisciplines that hitherto employed mostly or only mathematical or verbal-conceptual models. The focus of this monograph is on how scientific visualization can help revolutionize the manner in which the tendencies for (dis)similar numerical values to cluster together in location on a map are explored and analyzed, affording spatial data analyses that are better understood, presented, and used. In doing so, the concept known as spatial autocorrelation – which characterizes these tendencies and is one of the key features of georeferenced data, or data tagged to the earth’s surface – is further de-mystified. This self-correlation arises from relative locations in geographic space.
Daniel A. Griffith
Spatial Autocorrelation and Spatial Filtering [PDF ebook]
Gaining Understanding Through Theory and Scientific Visualization
Spatial Autocorrelation and Spatial Filtering [PDF ebook]
Gaining Understanding Through Theory and Scientific Visualization
Mua cuốn sách điện tử này và nhận thêm 1 cuốn MIỄN PHÍ!
Ngôn ngữ Anh ● định dạng PDF ● ISBN 9783540248064 ● Nhà xuất bản Springer Berlin Heidelberg ● Được phát hành 2013 ● Có thể tải xuống 3 lần ● Tiền tệ EUR ● TÔI 6315865 ● Sao chép bảo vệ Adobe DRM
Yêu cầu trình đọc ebook có khả năng DRM


